Live View (Top screen)
The place to monitor the signal details as they are received and as the log is scanned
Wi-Fi Dashboard
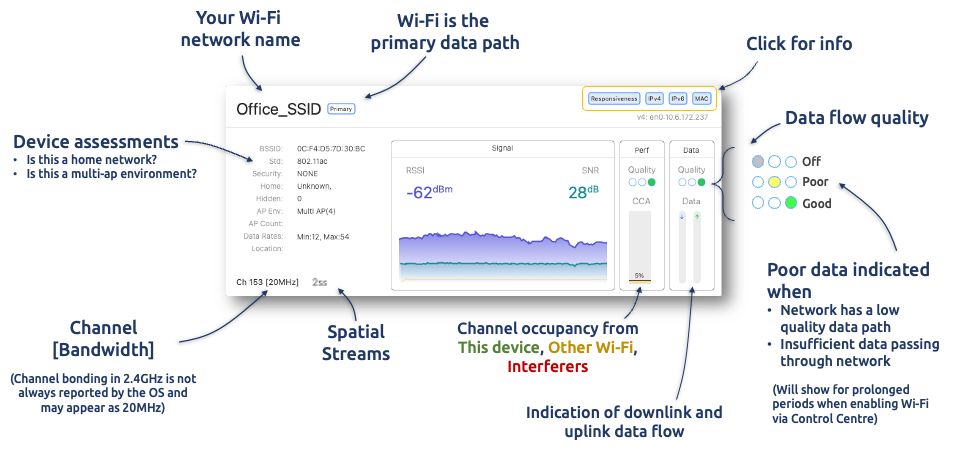
The Wi-Fi Dashboard is where the real-time Wi-Fi information is displayed as the logs are parsed.
It always shows the data at the location of the Timeline Slider. In live capture mode, with the Timeline Slider to the far right, it will continuously update and show the most recently received information.
If the Timeline Slider is moved, the Wi-Fi Dashboard will show the information at the location of the Timeline Slider.

Some of the information can be uncovered by pressing the buttons at the top right?
Load in a test file and move the Timeline Slider around to see how the charts change
Can you find the point where the signal is weakest
Can you find the point where the channel is busiest
Can you find a time when significant data is being passed over Wi-Fi
Do you remember where you saw "Responsiveness" before? Is there data in there - where did it come from and can you update it?
Are you using a Private or Device MAC to connect to this Wi-Fi
The flexible right dashboard
As has been seen in the settings, the right dashboard can be set to a number of different views.
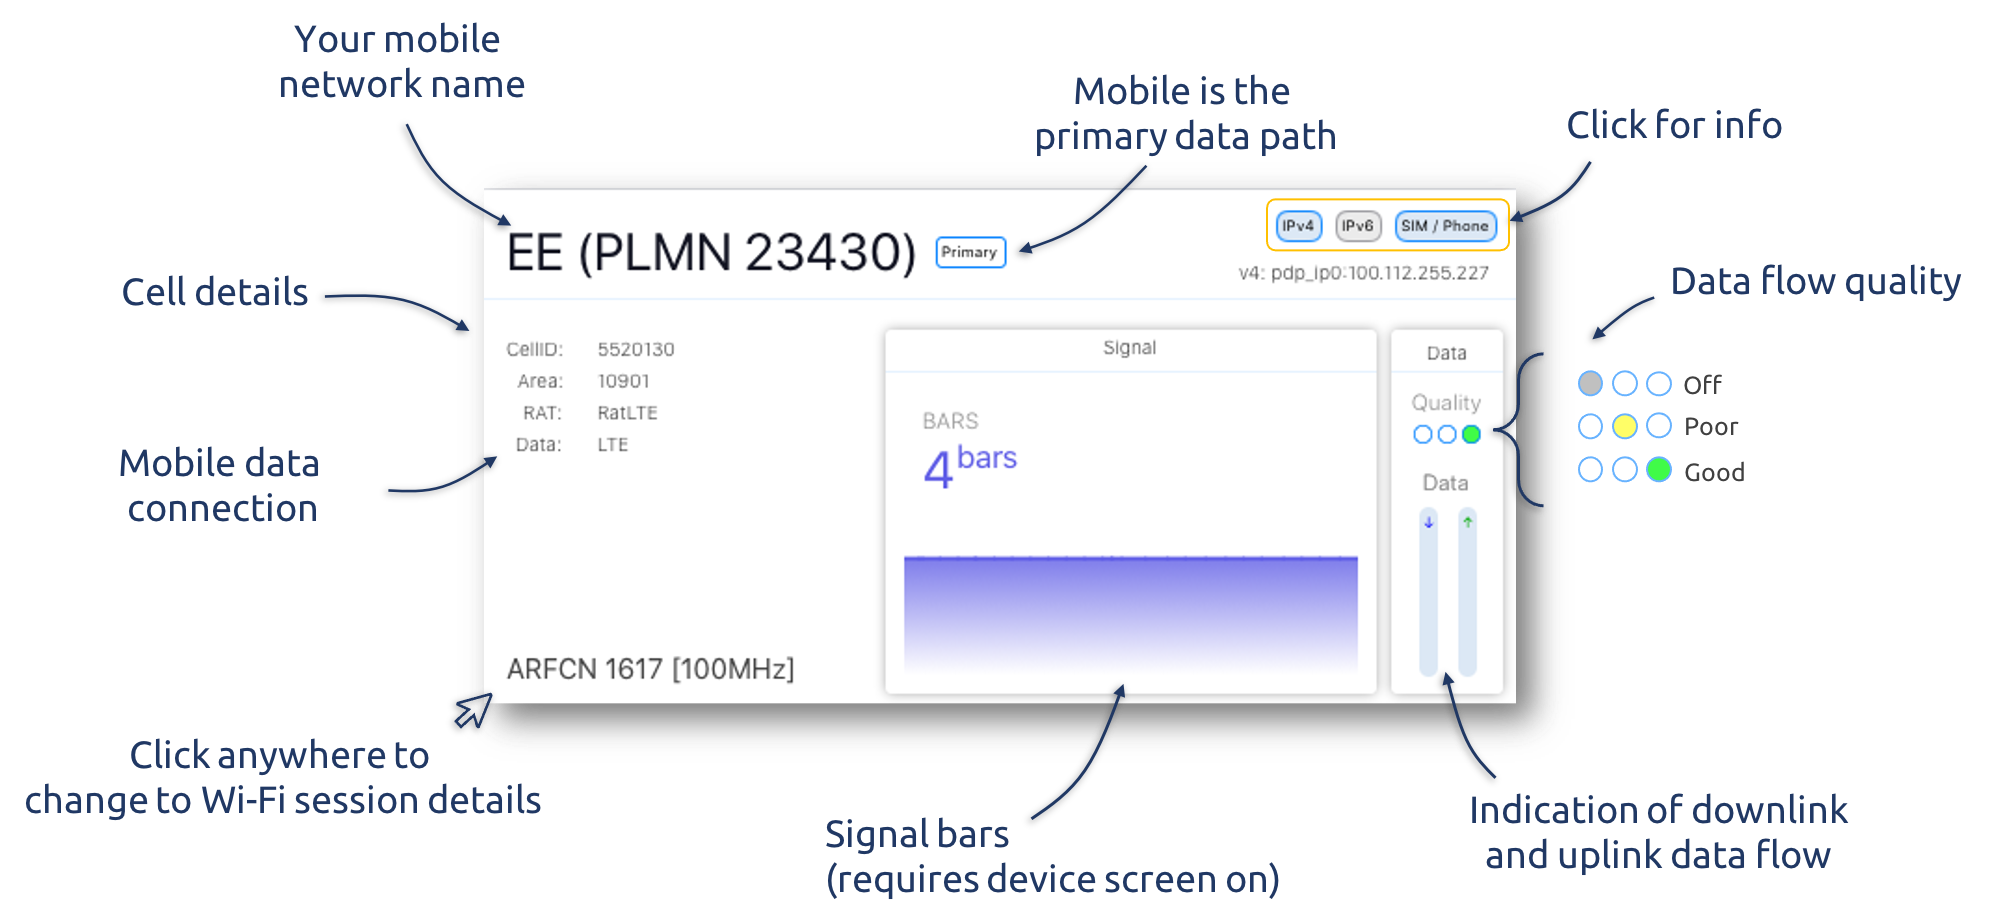
The default is the Cell Dashboard. It is very similar to the Wi-Fi dashboard. Take a look around.
When the Wi-Fi and Cell Dashboards are used together, the ![]() indicator next to the network name indicates which network is being used for primary traffic (it can be the case that both networks are passing data - in some circumstances)
indicator next to the network name indicates which network is being used for primary traffic (it can be the case that both networks are passing data - in some circumstances)
The other dashboard views are all covered in the next section.
Cell Dashboard

Load in a test file and move the Timeline Slider around to see how the charts change
Can you find details about the SIM
How many cell sites have been connected to in this test
Last updated